
Part Two
In the first instalment of this series, we asked why property in Britain's national parks is so important an issue and we set out the headline findings of the recent Lloyds Bank National Parks Review for England and Wales. These figures are crucial, to the extent that they create an overall picture of the state of property prices in the country's most treasured spaces, but they don't really offer an insight into the striking regional variations. Accordingly, today we consider the more detailed elements of this intriguing study and what they reveal about the housing markets in each of the parks. In the final part of our focus on the national parks, we will turn to Scotland.
Lloyds Bank National Parks Review: mapping the price premium
The following summaries chart the price premiums attracted by houses within twelve English and Welsh national parks. The data was collated by comparing official Land Registry sold prices within the parks with similar properties in the surrounding counties. We also include prices to wages ratios for each park, information which was obtained by Lloyds from the Office for National Statistics (ONS). As we mentioned in Part One, the Northumberland National Park is omitted from the study because, with a population of around 2,000, it doesn't generate the volume of transactions to make it directly comparable with its more populous counterparts. If you are interested in buying a home or investing in that lovely part of England, check out our feature "Focus on the North East at: https://nethouseprices.com/news/show/2497/uk-property-market-focus-on-the-north-east.
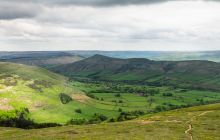
1. The Lake District National Park - Cumbria
- Average house price in Lake District = £364,193.
- Average house price in county = £177,843.
- Price premium to county = 105 per cent or £186,351.
- Price to wages ratio = 11.5
2. New Forest National Park - Hampshire and Wiltshire
- Average house price in the New Forest = £581,448.
- Average house price in counties = £312,592.
- Price premium to counties = 86 per cent or £268,856.
- Price to wages ratio = 15.2
3. Peak District National Park - Cheshire, Derbyshire, Greater Manchester, South and West Yorkshire and Staffordshire
- Average house price in the Peak District = £332,706.
- Average house price in counties = £180,737.
- Price premium to counties = 84 per cent or £151,969.
- Price to wages ratio = 10.2
4. South Downs National Park - Hampshire, East and West Sussex
- Average house price in South Downs = £536,330.
- Average house price in counties = £326,832.
- Price premium to counties = 64 percent or £209,377.
- Price to wages ratio = 14.9
5. Pembrokeshire Coast National Park - Pembrokeshire
- Average house price in Pembrokeshire Coast = £254,330.
- Average house price in county = £168,368.
- Price premium to county = 51 per cent or £85,962.
- Price to wages ratio = 9.0
6. Dartmoor National Park - Devon
- Average house price in Dartmoor = £309,154.
- Average house price in county = £243,247.
- Price premium to county = 27 per cent or £65,283.
- Price to wages ratio = 10.2
7. Yorkshire Dales National Park - North Yorkshire and Cumbria
- Average house price in Yorkshire Dales = £277,255.
- Average house price in counties = £219,247.
- Price premium to counties = 27 per cent or £58,309.
- Price to wages ratio = 8.6
8. Broads Authority - Norfolk and Suffolk
- Average house price in the Broads = £311,314.
- Average house price in counties = £247,657.
- Price premium to counties = 26 per cent or £63,657.
- Price to wages ratio = 9.6.
9. Exmoor National Park - Devon and Somerset.
- Average house price in Exmoor = £304,627.
- Average house price in counties = £243,542.
- Price premium to counties = 25 per cent or £61,085.
- Price to wages ratio = 9.8
10. North York Moors National Park - North Yorkshire
- Average house price in North York Moors = £298,936.
- Average house price in county = £245,366.
- Price premium to county = 22 per cent or £53,570.
- Price to wages ratio = 9.2.
11. Brecon Beacons National Park - Blaenau Gwent, Caerphilly, Carmarthenshire, Rhondda Cynon Taf, Merthyr Tydfil, Monmouthshire, Powys, Torfaen
- Average house price in Brecon Beacons = £222,631.
- Average house price in counties = £194,355.
- Price premium to counties = 15 per cent or £28,276.
- Price to wages ratio = 8.3.
12. Snowdonia National Park - Gwynedd and Conwy
- Average house price in Snowdonia = £180,126.
- Average house price in counties = £185,062.
- Price premium to counties = -3 per cent or -£4936.
- Price to wages ratio = 6.8.
Nethouseprices view
In truth, some of the findings are not especially surprising. For example, few eyebrows will rise on reading that the New Forest and South Downs boast some of the highest house prices in the UK. The sheer scale of the property price premium within these parks is probably unexpected, though. Even more startling are the figures for some of the more northerly parks, with the price premium and price to wage ratio in the Lake District being particularly eye-catching. This evidence underscores the point we made in Part One about how local residents of the parks often feel as though they are being priced out of the places they call home. There is no easy solution to this problem. The cost of housing in the rest of the country can be partly addressed by building hundreds of thousands more homes. This isn't really an option in the national parks where, even if they weren't strictly limited by law, the public would object to extensive construction projects. Certainly, if you are lucky enough to own a property in one of these magnificent areas, you are unquestionably in possession of an asset which is valuable in more ways than just financial.
In Part Three, we will consider the Scottish parks. Visit us again soon for this and for our updates on house prices in the UK and other developments in the property market. Don't forget that you are welcome to explore our other resources, including our free instant house valuation tool.
Part Two
In the first instalment of this series, we asked why property in Britain's national parks is so important an issue and we set out the headline findings of the recent Lloyds Bank National Parks Review for England and Wales. These figures are crucial, to the extent that they create an overall picture of the state of property prices in the country's most treasured spaces, but they don't really offer an insight into the striking regional variations. Accordingly, today we consider the more detailed elements of this intriguing study and what they reveal about the housing markets in each of the parks. In the final part of our focus on the national parks, we will turn to Scotland.
Lloyds Bank National Parks Review: mapping the price premium
The following summaries chart the price premiums attracted by houses within twelve English and Welsh national parks. The data was collated by comparing official Land Registry sold prices within the parks with similar properties in the surrounding counties. We also include prices to wages ratios for each park, information which was obtained by Lloyds from the Office for National Statistics (ONS). As we mentioned in Part One, the Northumberland National Park is omitted from the study because, with a population of around 2,000, it doesn't generate the volume of transactions to make it directly comparable with its more populous counterparts. If you are interested in buying a home or investing in that lovely part of England, check out our feature "Focus on the North East at: https://nethouseprices.com/news/show/2497/uk-property-market-focus-on-the-north-east.
1. The Lake District National Park - Cumbria
- Average house price in Lake District = £364,193.
- Average house price in county = £177,843.
- Price premium to county = 105 per cent or £186,351.
- Price to wages ratio = 11.5
2. New Forest National Park - Hampshire and Wiltshire
- Average house price in the New Forest = £581,448.
- Average house price in counties = £312,592.
- Price premium to counties = 86 per cent or £268,856.
- Price to wages ratio = 15.2
3. Peak District National Park - Cheshire, Derbyshire, Greater Manchester, South and West Yorkshire and Staffordshire
- Average house price in the Peak District = £332,706.
- Average house price in counties = £180,737.
- Price premium to counties = 84 per cent or £151,969.
- Price to wages ratio = 10.2
4. South Downs National Park - Hampshire, East and West Sussex
- Average house price in South Downs = £536,330.
- Average house price in counties = £326,832.
- Price premium to counties = 64 percent or £209,377.
- Price to wages ratio = 14.9
5. Pembrokeshire Coast National Park - Pembrokeshire
- Average house price in Pembrokeshire Coast = £254,330.
- Average house price in county = £168,368.
- Price premium to county = 51 per cent or £85,962.
- Price to wages ratio = 9.0
6. Dartmoor National Park - Devon
- Average house price in Dartmoor = £309,154.
- Average house price in county = £243,247.
- Price premium to county = 27 per cent or £65,283.
- Price to wages ratio = 10.2
7. Yorkshire Dales National Park - North Yorkshire and Cumbria
- Average house price in Yorkshire Dales = £277,255.
- Average house price in counties = £219,247.
- Price premium to counties = 27 per cent or £58,309.
- Price to wages ratio = 8.6
8. Broads Authority - Norfolk and Suffolk
- Average house price in the Broads = £311,314.
- Average house price in counties = £247,657.
- Price premium to counties = 26 per cent or £63,657.
- Price to wages ratio = 9.6.
9. Exmoor National Park - Devon and Somerset.
- Average house price in Exmoor = £304,627.
- Average house price in counties = £243,542.
- Price premium to counties = 25 per cent or £61,085.
- Price to wages ratio = 9.8
10. North York Moors National Park - North Yorkshire
- Average house price in North York Moors = £298,936.
- Average house price in county = £245,366.
- Price premium to county = 22 per cent or £53,570.
- Price to wages ratio = 9.2.
11. Brecon Beacons National Park - Blaenau Gwent, Caerphilly, Carmarthenshire, Rhondda Cynon Taf, Merthyr Tydfil, Monmouthshire, Powys, Torfaen
- Average house price in Brecon Beacons = £222,631.
- Average house price in counties = £194,355.
- Price premium to counties = 15 per cent or £28,276.
- Price to wages ratio = 8.3.
12. Snowdonia National Park - Gwynedd and Conwy
- Average house price in Snowdonia = £180,126.
- Average house price in counties = £185,062.
- Price premium to counties = -3 per cent or -£4936.
- Price to wages ratio = 6.8.
Nethouseprices view
In truth, some of the findings are not especially surprising. For example, few eyebrows will rise on reading that the New Forest and South Downs boast some of the highest house prices in the UK. The sheer scale of the property price premium within these parks is probably unexpected, though. Even more startling are the figures for some of the more northerly parks, with the price premium and price to wage ratio in the Lake District being particularly eye-catching. This evidence underscores the point we made in Part One about how local residents of the parks often feel as though they are being priced out of the places they call home. There is no easy solution to this problem. The cost of housing in the rest of the country can be partly addressed by building hundreds of thousands more homes. This isn't really an option in the national parks where, even if they weren't strictly limited by law, the public would object to extensive construction projects. Certainly, if you are lucky enough to own a property in one of these magnificent areas, you are unquestionably in possession of an asset which is valuable in more ways than just financial.
In Part Three, we will consider the Scottish parks. Visit us again soon for this and for our updates on house prices in the UK and other developments in the property market. Don't forget that you are welcome to explore our other resources, including our free instant house valuation tool.
You can also sign up to our newsletter and join Nethouseprice’s community of over 190,000 members who get regular property tips, relevant offers and news, click here http://nethouseprices.com/auth/user-register

Make a comment